Sunday, 25 March 2018

How to open Jmeter jtl file in Excel example

How to open Jmeter jtl file in Excel example gives you knowledge about open jmeter Test results jtl file in Excel workbook with real time example.Please follow below steps to open Jmeter jtl file in Excel.Using Jmeter you can save Test result file in csv,xls,txt and jtl formats and with the help of Simple Data Writer Listener as provided specific path in local system.


How to open Jmeter jtl file in Excel example


In order to perform above task we require below details,those are

1. Jmeter Test Plan.
2.Some HTTP/SOAP/REST service Samples.
3. Listener - Simple Data Writer.
4.Write results to file Path .
5.Set Up Thread group for Number of virtual users to run.
6.In case you are using apache-jmeter-3.0 new version then you need to copy paste below xsl files from old version and my old apache jmeter version is "apache-jmeter-2.13".
Go to apache-jmeter-2.13/extras folder then you will find below XSL format files,those are

  1. jmeter-results-detail-report.xsl
  2. jmeter-results-detail-report_21.xsl
  3. jmeter-results-report.xsl
  4. jmeter-results-report_21.xsl

7.Just copy paste above old version files in new version that is apache-jmeter-3.0/extras,it will looks like below.Let's see below example to generate jmeter results file in jtl format which is save in xml format with .jtl extension and adding some simple path in xml file,then only jtl file will open in Excel workbook.


Configurations in Simple Data Writer:


Before running your Test plan in Jmeter,you need to configure Sample Result Save Configuration in Simple Data Writer window panel,Please follow below steps.

STEP 1 : Add Simple Data writer from Right click on Thread Group - Add - Listener - Simple Data Writer
STEP 2 : Click on Configure button.
STEP 3 : Select require check boxes to save in results file.

Note : In case Save as XML checkbox is not selected in Sample Result Save Configuration dialog box then your jtl result file save in csv format but we require to save it in XML format.

STEP 4 : Select Save as XML check box in Sample Result Save Configuration dialog box.
STEP 5 : Now enter Write results to file/Read from File path with file name as E:\JMETER\TestResults\Test-results.jtl

Note : You should not create jtl extension file manually because Simple Data Writer automatically creates given file name with .jtl extension.

STEP 6 : Now Run your Test Plan
STEP 7 : Now open Specified File name results path and you will see Test-results.jtl file is generated as below.

JTL Test Result File

STEP 8 : Now open .jtl file in Notepad or Wordpad or Notepad++ ,it will open as below.

STEP 9 : Now copy below path in between <?xml version="1.0" encoding="UTF-8"?> and <testResults version="1.2">

Code : <?xml-stylesheet type="text/xsl" href="F:\Java_Applications\apache-jmeter-3.0\extras\jmeter-results-detail-report_21.xsl"?>

STEP 10 : Save your .jtl file and close the same.
STEP 11 : Open empty Excel workbook and drag and drop .jtl test results file into Excel workbook,select "Open the file with the following style sheet applied(Select One)"


STEP 12 : Click on OK button.
STEP 13 : Again click on Yes button.
STEP 14 : Now your Test Results reports will generate in Excel workbook as below.

Test Result:


You will see below Load Test Results.


Monday, 19 March 2018

Reading AWR Reports (Basic Approach)

If you are new to the AWR reports, the first thing you should probably do is run the ADDM report for the specific time period. The ADDM report provides root cause analysis of the parts of the system consuming the most time. It is often quicker to start with the ADDM report to help narrow down your area of focus in the AWR report.
When looking at an AWR report, a good place to start is the "Top 5 Timed Foreground Events" section, near the top of the report. This gives you an indication of the bottlenecks in the system during this sample period.

Once you've identified the top events, drill down to see what SQL and PL/SQL are consuming the majority of those resources. On the "Main Report" section, click the "SQL Statistics" link.

On the "SQL Statistics" section, click the "SQL ordered by ??" link that most closely relates to the wait event you identified in the "Top 5 Timed Foreground Events" section. In this case, the "DB CPU" was the top event, so it would seem sensible to try the "SQL ordered by CPU Time" link first.

You are then presented with the SQL and PL/SQL that are using most of the specified resource during the sample period. You can then attempt to tune these areas to reduce the impact.

AWR(Automatic Workload Repository) & It's Features

The AWR is used to collect performance statistics including:
  • Wait events used to identify performance problems.
  • Time model statistics indicating the amount of DB time associated with a process from the V$SESS_TIME_MODEL and V$SYS_TIME_MODEL views.
  • Active Session History (ASH) statistics from the V$ACTIVE_SESSION_HISTORY view.
  • Some system and session statistics from the V$SYSSTAT and V$SESSTAT views.
  • Object usage statistics.
  • Resource intensive SQL statements.

How to read AWR report?

This section contains detailed guidance for evaluating each section of an AWR report.  

Report Summary: This gives an overall summary of the instance during the snapshot period, and it contains important aggregate summary information.

Cache Sizes (end): This shows the size of each SGA region after AMM has changed them.  This information can be compared to the original init.oraparameters at the end of the AWR report.

Load Profile: This important section shows important rates expressed in units of per second and transactions per second.

Instance Efficiency Percentages: With a target of 100%, these are high-level ratios for activity in the SGA.

Shared Pool Statistics: This is a good summary of changes to the shared pool during the snapshot period.

Top 5 Timed Events: This is the most important section in the AWR report.  It shows the top wait events and can quickly show the overall database bottleneck.

Wait Events Statistics Section: This section shows a breakdown of the main wait events in the database including foreground and background database wait events as well as time model, operating system, service, and wait classes statistics.

Wait Events: This AWR report section provides more detailed wait event information for foreground user processes which includes Top 5 wait events and many other wait events that occurred during the snapshot interval.

Background Wait Events: This section is relevant to the background process wait events.

Time Model Statistics: Time mode statistics report how database-processing time is spent. This section contains detailed timing information on particular components participating in database processing.

Operating System Statistics: The stress on the Oracle server is important, and this section shows the main external resources including I/O, CPU, memory, and network usage.

Service Statistics: The service statistics section gives information about how particular services configured in the database are operating.

SQL Section: This section displays top SQL, ordered by important SQL execution metrics.
          SQL Ordered by Elapsed Time: Includes SQL statements that took significant execution time during processing.
          SQL Ordered by CPU Time: Includes SQL statements that consumed significant CPU time during its processing.
          SQL Ordered by Gets: These SQLs performed a high number of logical reads while retrieving data.
          SQL Ordered by Reads: These SQLs performed a high number of physical disk reads while retrieving data.
          SQL Ordered by Parse Calls: These SQLs experienced a high number of reparsing operations.
          SQL Ordered by Sharable Memory: Includes SQL statements cursors which consumed a large amount of SGA shared pool memory.
          SQL Ordered by Version Count: These SQLs have a large number of versions in shared pool for some reason.

Instance Activity Stats: This section contains statistical information describing how the database operated during the snapshot period.
          Instance Activity Stats (Absolute Values): This section contains statistics that have absolute values not derived from end and start snapshots.
          Instance Activity Stats (Thread Activity): This report section reports a log switch activity statistic.

I/O SectionThis section shows the all important I/O activity for the instance and shows I/O activity by tablespace, data file, and includes buffer pool statistics.
          Tablespace IO Stats 
          File IO Stats 
          Buffer Pool Statistics 

Advisory SectionThis section show details of the advisories for the buffer, shared pool, PGA and Java pool.
          Buffer Pool Advisory 
          PGA Aggr Summary: PGA Aggr Target Stats; PGA Aggr Target Histogram; and PGA Memory Advisory. 
          Shared Pool Advisory 
          Java Pool Advisory 

Buffer Wait Statistics: This important section shows buffer cache waits statistics.

Enqueue Activity: This important section shows how enqueue operates in the database. Enqueues are special internal structures which provide concurrent access to various database resources.
Undo Segment Summary: This section gives a summary about how undo segments are used by the database.

Undo Segment Stats: This section shows detailed history information about undo segment activity.

Latch Activity: This section shows details about latch statistics. Latches are a lightweight serialization mechanism that is used to single-thread access to internal Oracle structures.
          Latch Sleep Breakdown
          Latch Miss Sources
          Parent Latch Statistics
          Child Latch Statistics

Segment Section: This report section provides details about hot segments using the following criteria:
          Segments by Logical Reads: Includes top segments which experienced high number of logical reads.
          Segments by Physical Reads: Includes top segments which experienced high number of disk physical reads.
          Segments by Buffer Busy Waits: These segments have the largest number of buffer waits caused by their data blocks.
          Segments by Row Lock Waits: Includes segments that had a large number of row locks on their data.
          Segments by ITL Waits: Includes segments that had a large contention for Interested Transaction List (ITL). The contention for ITL can be reduced by increasing INITRANS storage parameter of the table.

Dictionary Cache Stats: This section exposes details about how the data dictionary cache is operating.

Library Cache Activity: Includes library cache statistics describing how shared library objects are managed by Oracle.

SGA Memory Summary: This section provides summary information about various SGA regions.


init.ora ParametersThis section shows the original init.ora  parameters for the instance during the snapshot period.

Database Performance testing using JDBC connection through Jmeter

Follow below steps to configure the Jmeter to connect your database.


STEP 1: Open a new Test Plan and add a Thread Group in it.
STEP 2: Add a 'JDBC Connection Configuration' from 'Configuration Element' menu into the Thread group.


STEP 3: Configure the 'JDBC Connection configuration' with respective database/tables as described below.


*Variable Name: We need to create a name for the JDBC pool. So that we can reference the pool name while executing a SQL query.


*Pool Configuration: Need to provide the number of concurrent connection in 'JDBC POOL'. (we used just 5, which means we can run just 5 parallel users only). Need to specify the pool timeout value too.
* Database Connection Configuration: This is the place we need to provide our database name, host and port.
Database URL:- jdbc:mysql://ip:port/databasename for MySql database
The access credentials need to be added into it.
* JDBC Driver Class:
Jmeter does not come with MySQL JDBC driver. We need to download the latest JDBC MySQL connector jar file driver(ex;- Mysql-connector-java-5.1.23-bin) from Oracle site and hold a copy in Jmeter/lib folder.
Mention the driver name in this column as "com.mysql.jbdc.driver" for MYSQL database,
we can execute the query.
STEP 4 : JDBC Sampler
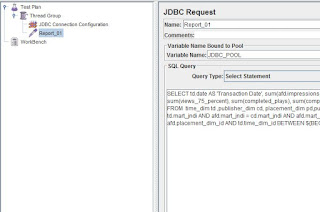
Add a JDBC sampler from ADD > Sampler > JDBC Request.


STEP 5: Add the SQL


* Give the sampler a valid name to be referenced in results
* Provide a valid Variable pool name, which we created in STEP 3 ( 'JDBC POOL')
* Type your SQL Query in the space provided.

STEP 6: Add a View Results Tree to observe the results.


STEP 7 : Para-metering the SQL
Create a list of parameters to be used in SQL in a 'User Defined Variables' configuration.


Refer the above created parameters in the SQL as required.


STEP 8: Execute the Jmeter


Configure the Thread group with number of Threads. These value give the number of Vusers run concurrently.
Please make sure these value does not exceed the pool configuration connection count 5(STEP 3)


Now you can observe the result of SQL in the 'View Results Tree' node.

Creating Web Services Script in LoadRunner using WebService/Web(http/html) Protocol

Some Important Definitions:
 Web Services:
It is a web application components which can be published & used on web.
Web services do not require the use of browsers or HTML.
In Web Service XML is used to tag the data, SOAP is used to transfer the data, WSDL is used for describing the services available and UDDI is used for listing what services are available.
 XML: EXtensive Markup Language
XML is designed to describe the data & act as a tool for carrying information.
 SOAP: Simple Object Access Protocol
It is a protocol for accessing web services.
Soap is a format for sending messages & used for communication between applications.
 WSDL: Web Services description Language
It is an XML document which is used to describe & locate web services.
It specifies the location of the service and the operations (or methods).

 Data requirements:
•Sample Request & Response XML.
•End Point URL(Host) where request xml to be posted. E.ghttp://webservice.nam.nsroot.net/
•WSDLfile to get the information & soap action for all the existing operations/methods.
•Operation details which needs to be invoked like “GetLoadDetails”.
•SSL Certificate(also known as a Web Server Certificate, Secure Server Certificate, and Digital Certificate) & password if the host is SSL secured.
Two different ways of creating Web Services Script:

We can do web services scripting in two ways:

•By using Web Services Protocol.
•By using Web(HTTP/HTML) Protocol.
Steps for writing script:


•Open the Vugen and select Web Services protocol.
•Click on Import SOAP on top navigation bar and select request xml file.
•Click LOAD and provide End Point URL(Host) & Soap action then press OK.
•Soap request will be created with the step name “SOAP Request”.
Error Handling & Validation:

lr_xml_find and lr_xml_get_valuesfunctions can be used to validate the page. If-Else statement can be used to validate the resposne.
Example:
lr_xml_find("XML={response}",
"Query=//SOAP-ENV:Body/*/LoanAmount",
"Value=2000",
LAST );
lr_xml_get_values("Xml={response}",
"Query=//SOAP-ENV:Header/*/UUID",
"ValueParam=UUID",
LAST);
Error Handling:
if (strcmp(lr_eval_string("{Response}"), "0") != 0 )
{lr_end_transaction (“Submit_Request", LR_FAIL);
LR_EXIT_ITERATION_AND_CONTINUE;
lr_error_message(“Invalid Response"));
return 0;
}
else
{lr_end_transaction ("Submit_Request ", LR_PASS);
}